Using the Garmin Forerunner 205 with R on Ubuntu 10.10
Below I describe how I use Ubuntu and the GNU R statistical computation and graphics system for analyzing data from my jogging tracks. In particular I describe how to
- copy the data from the Garmin Forerunner to a sqlite database on my Ubuntu system
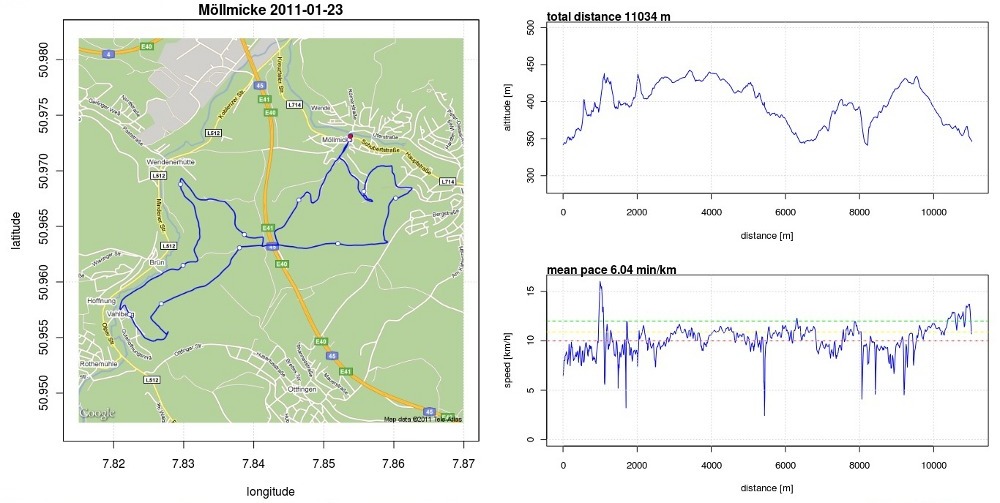
- plot course data from the database using R
- retrieve Google maps using R and overplot my course
In my example I use a sqlite database to store the track data, but using e.g. postgresql is just as easy. Just install the respective packages and change the configuration of your ODBC data source accordingly.
Prerequisites
- Ubuntu packages which need to be installed
- garmin-forerunner-tools
- r-base-core
- sqlite3
- python-sqlite
- unixodbc-dev
- libsqliteodbc
- libgdal1-dev
- libproj-dev
- R packages which need
to be installed
- RODBC
- png
- RgoogleMaps
- sp
- rgdal
For each of the required R packages, download the source
sudo R CMD INSTALL -l /usr/lib/R/site-library <package>.tar.gz
Create the sqlite3 database
$ sqlite3 jogging.db
SQLite version 3.7.2
Enter ".help" for instructions
Enter SQL statements terminated with a ";"
sqlite> CREATE TABLE rounds (
           id INTEGER PRIMARY KEY,
           date timestamp,
           round varchar(64));
sqlite> CREATE TABLE gmn (
           rid INTEGER,
           time timestamp,
           latitude float,
           longitude float,
           altitude float,
           distance float);
Adding tracks
Copy your latest track from the Forerunner to your local disk using the utility that comes with the garmin-forerunner-tools:
$ garmin_save_runs
How to add a track to the jogging database:
$ ./addround.py <description> <gmn-file>
E.g.:
$ ./addround.py Möllmicke 2011/01/20110123T093114.gmn
where the python script addround.py uses the tool garmin_dump to translate the gmn-file to ASCII and writes the parsed output to the sqlite database.
To check available track data:
$ sqlite3 jogging.db
sqlite> select * from rounds;
Make the sqlite database available in R by editing your .odbc.ini file to contain
[jogging]
Driver = /usr/lib/odbc/libsqlite3odbc.so
Setup = /usr/lib/odbc/libsqlite3odbc.so
Database = /path/to/your/jogging.db
[ODBC]
InstallDir = /usr/lib
To plot our data in R, run the script garminsql.R in your R environment:
$ R
> source("garminsql.R")
> rnd <- plotround(<id>, download=TRUE)
where
The resulting plot should look similar to this one: